
Real-time Candlestick Update - Get the Latest Pattern
The data below is presented to make it easier for you to get candle updates in major pairs from various time frames. Thus, you don't need to manually interpret candlestick patterns on the chart to get trading signals.
| Time Frame | Indication | Candle Time |
|
NZD-USD
Monthly
|
|
Now |
|
|
||
|
A two-candle pattern, the first candle is bearish and "engulfed" by the second bullish candle. This candle pattern indicates a weakening of the downtrend momentum which is taken over by bullish sentiment. |
||
|
USD-JPY
Monthly
|
|
Now |
|
|
||
|
This pattern consists of two candlesticks. The first candle is bullish and bigger and engulfs the second candle which is a bearish pattern. This pattern indicates that the uptrend is starting to lose momentum. The axes of the second candlestick have not to be in the range of the first candlestick, although this condition can increase the signal accuracy. |
||
|
AUD-USD
H5
|
|
May 17 2024 11:00:00 |
|
|
||
|
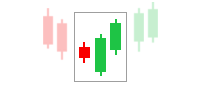
A three-candle pattern, the first 2 candles form a Bullish Engulfing formation, while the third candle pattern is a bullish candle that confirms a bullish reversal. |
||
|
EUR-USD
M15
|
|
May 17 2024 16:30:00 |
|
|
||
|
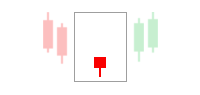
A one-candle pattern that closes near or at the highest price (High), thus indicating a weakening of the downtrend momentum. The longer the lower axis and the smaller the body candle, the higher the accuracy of the bullish reversal signal. |
||
|
AUD-USD
H5
|
|
May 17 2024 06:00:00 |
|
|
||
|
A two-candle pattern, the first candle is bearish and "engulfed" by the second bullish candle. This candle pattern indicates a weakening of the downtrend momentum which is taken over by bullish sentiment. |
||
|
NZD-USD
H1
|
|
May 17 2024 13:00:00 |
|
|
||
|
A one-candle pattern that occurs at the top of an uptrend. The open creates a gap up from the previous candle, then closes near the low. A confirmation signal breach is obtained from the next candle that opens with a price below the Shooting Star body candle. |
||
|
XAU-USD
H1
|
|
May 17 2024 12:00:00 |
|
|
||
|
A two-candle pattern, it is consisting of a first long bearish candle at the end of the downtrend, the second candle has a small body with almost the same opening price compared to the closing price. If the second candle gets smaller, it means the higher the accuracy of the bullish signal. |
||
|
XAU-USD
H1
|
|
May 17 2024 12:00:00 |
|
|
||
|
This pattern consists of two candlesticks. The first candle is bearish and engulfs the second bullish candle. This pattern indicates that the downtrend is starting to lose momentum. Although it can increase signal accuracy, the axes of the second candlestick do not have to be in the range of the first candlestick. |
||
| Completed Patterns | ||
|
|
||
|
@@WRpEf |
||
|
|
||
|
A one-candle pattern opened lower than the previous candle. The feature of the Inverted Hammer is that it has a small body and a long upper axis. The longer the upper axis and the smaller the body, the more significant the Inverted Hammer bullish signal. |
||
|
|
||
|
A one-candle pattern that closes near or at the highest price (High), thus indicating a weakening of the downtrend momentum. The longer the lower axis and the smaller the body candle, the higher the accuracy of the bullish reversal signal. |
||
|
|
||
|
A three-candle pattern, the first candle is long bearish followed by the second candle that forms a gap down and has a small body. The third candle is a bullish candle confirming a reversal. The bigger of the third body candle reflects the accuracy of the bullish reversal signal. |
||
|
|
||
|
A three-candle pattern, the first 2 candles form a Bullish Engulfing formation, while the third candle pattern is a bullish candle that confirms a bullish reversal. |
||
|
|
||
|
A two-candle pattern, the first candle is bearish and "engulfed" by the second bullish candle. This candle pattern indicates a weakening of the downtrend momentum which is taken over by bullish sentiment. |
||
|
|
||
|
A one-candle pattern that occurs at the top of an uptrend. The open creates a gap up from the previous candle, then closes near the low. A confirmation signal breach is obtained from the next candle that opens with a price below the Shooting Star body candle. |
||
|
|
||
|
A one-candle pattern that occurs at the top of an uptrend. The open creates a gap up from the previous candle, then closes near the low. A confirmation signal breach is obtained from the next candle that opens with a price below the Shooting Star body candle. |
||
|
|
||
|
A one-candle pattern that occurs at the top of an uptrend. The open creates a gap up from the previous candle, then closes near the low. A confirmation signal breach is obtained from the next candle that opens with a price below the Shooting Star body candle. |
||


What is the formula of Heikin Ashi candlestick?
- HA Open = (Open (previous) Close (previous)) / 2
- HA Close = (Open (current) High (current) Low (current) Close (current)) / 4
- HA High = The highest between the High (current), HA Open, and HA Close
- HA Low = The lowest between the Low (current), HA Open, and HA Close
The HA Open is always at the midpoint of the previous candle as it is the average value of the previous open and close. Meanwhile, the HA Close is the average value of the four prices in the current period.
It is possible for a Heikin-Ashi candlestick to not have an upper shadow if the current High is not the actual high of the current period. Likewise, a Heikin-Ashi candlestick may not have a lower shadow if the current Low is not the actual low of the current period.
Continue Reading at Heikin-Ashi Strategy: An Easy Way to Follow the Trend
How can candlesticks help you identify market sentiment?
If you use the candlesticks along with resistance and support lines, you will never get lost - and never guess your way around. Simply pay attention to sentiment shifts that are reflected by the candlesticks formations that occur or coincide with significant support or resistance lines – particularly those that pop up – in the level of historical highs or lows. With a great degree of accuracy, the market is likely to either 'hiccup' or take a big leap forward from that point.
In fact, there is no better tool to use to formulate a profitable swing trade strategy except with candlesticks along with resistance and support lines.
Continue Reading at Swing Trading, The Ideal Trading Strategy For Retail Forex Traders
What is the main difference between Heikin Ashi and common candlesticks?
The Heikin-Ashi chart appears to have no gaps because the candlesticks always start in the middle of the previous candles. Additionally, the shadows of the Heikin-Ashi candlesticks are generally tighter in range than those of the traditional ones. This is because the Heikin-Ashi candlesticks calculate the average values.

Continue Reading at Heikin-Ashi Strategy: An Easy Way to Follow the Trend
What are bullish and bearish engulfing candlestick patterns?
A bullish candlestick pattern always appears in a downtrend. It is characterized by the price moving lower, typically shown via red or black candles. Then after that, there's a large candle often colored green or white, which is larger than the previous bearish candle.
The same concept goes to the bearish engulfing pattern but in the opposite way. The price should be going up and then there's a large down candle that envelops the last up candle. This means that the sellers are entering the market aggressively.

Continue Reading at A Useful Guide to Combine Candlesticks with Indicators


Articles About Candlestick